

Food prices in Davao have become an increasingly important concern for households managing their monthly budgets in 2026. Recent Philippine Statistics Authority data show significant price pressure in several major food categories, including rice, vegetables, fish and seafood. But the impact is not the same for every household: what a family spends depends on its food choices, consumption habits, income and where it shops.
For many families in Davao, the weekly grocery or market trip has become an increasingly important part of household financial planning. Rice, fish, vegetables, meat, cooking oil and other everyday foods can take a substantial share of monthly income, particularly when several major food categories experience price pressure at the same time.
The latest Philippine Statistics Authority (PSA) data show that food prices remained under significant pressure in Davao Region in August 2026. Regional food inflation reached 10.5 percent year on year, up from 10.0 percent in July. Rice recorded 26.0 percent inflation, while vegetables, tubers, plantains, cooking bananas and pulses recorded 22.8 percent. Fish and other seafood recorded 16.3 percent inflation.
The situation was more pronounced for Bottom 30% Income Households. Food inflation for this group reached 14.4 percent in August 2026, while rice inflation reached 31.2 percent and vegetables and related products reached 29.6 percent.
These figures do not mean every Davao family experienced exactly the same increase in its grocery bill. Inflation is based on a statistical basket of goods and services, while each household has its own consumption pattern.
There is also an important geographical distinction. Davao Region includes Davao City and five provinces, so a regional inflation rate should not automatically be treated as the inflation rate experienced by every household in Davao City.
This guide examines what the latest data show, how higher food prices can affect household budgets, and how families can make practical adjustments without relying on unrealistic assumptions.
What the latest Davao food inflation data show
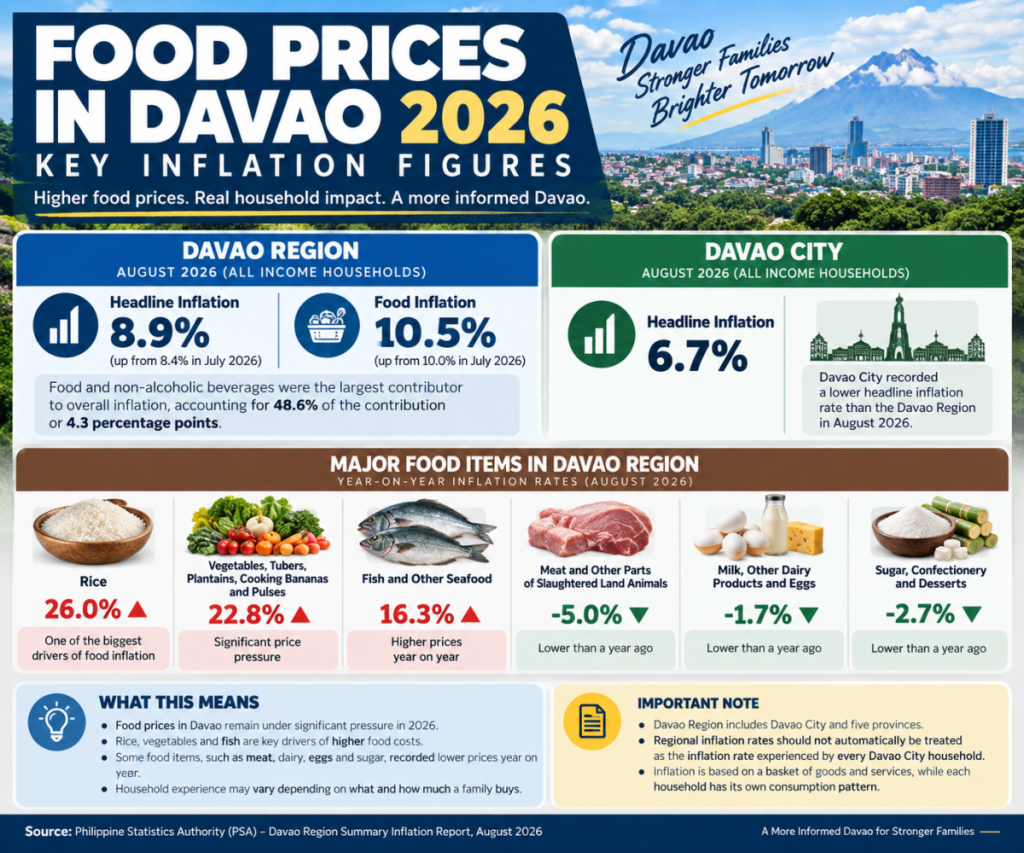
Davao Region’s headline inflation reached 8.9 percent in August 2026, increasing from 8.4 percent in July. Food and non-alcoholic beverages were the largest contributor to the overall regional inflation rate, accounting for 48.6 percent of the contribution, equivalent to 4.3 percentage points.
Food inflation itself reached 10.5 percent in August, compared with 10.0 percent in July.
The composition of that food inflation is particularly important.
Rice was one of the major drivers, with inflation accelerating to 26.0 percent. Fish and other seafood recorded 16.3 percent inflation, while vegetables, tubers, plantains, cooking bananas and pulses recorded 22.8 percent.
At the same time, some food categories did not experience year-on-year increases. Meat and other parts of slaughtered land animals recorded -5.0 percent inflation, while milk, other dairy products and eggs recorded -1.7 percent. Sugar, confectionery and desserts recorded -2.7 percent.
This demonstrates why it would be inaccurate to say that every food product became more expensive by the same amount.
A family that purchases large quantities of rice and vegetables can have a very different experience from a family that buys less rice and relies more heavily on food categories with lower or negative inflation.
Davao City is different from the wider Davao Region
One of the most important distinctions for readers is the difference between Davao City and Davao Region.
Davao Region includes Davao City, Davao de Oro, Davao del Norte, Davao del Sur, Davao Occidental and Davao Oriental.
In August 2026, Davao City recorded headline inflation of 6.7 percent, while the Davao Region-wide rate was 8.9 percent.
The difference illustrates why regional statistics should be presented carefully.
A reader living in Davao City should not assume that an 8.9 percent regional inflation rate means household prices in the city increased by exactly 8.9 percent.
The same applies in the opposite direction. A lower city-wide headline inflation rate does not mean every food item became cheaper or increased only modestly.
Inflation is calculated using a broad basket of goods and services. Individual households experience price changes according to the products they purchase and the proportion of their budget devoted to those products.
For a Davao City family, the most useful approach is therefore to combine official statistics with its own grocery and market records.
Why food inflation can feel higher than the headline inflation rate
A household does not purchase every item represented in the consumer price index.
A family may spend a large portion of its income on food while spending relatively little on other categories represented in the broader inflation basket.
If the food products that dominate the family’s budget experience substantial price increases, the family’s personal experience can feel considerably different from the overall inflation rate.
For example, suppose a household spends a large amount on rice, fish and vegetables.
If those three categories are experiencing significant price pressure, the family may notice a larger increase in its weekly food bill even if some other household expenses have remained relatively stable.
This is why headline inflation should be treated as a broad economic indicator rather than a personal household budget calculator.
Rice remains one of the biggest pressure points
Rice is particularly important because it is a staple food for many Filipino households and is purchased frequently.
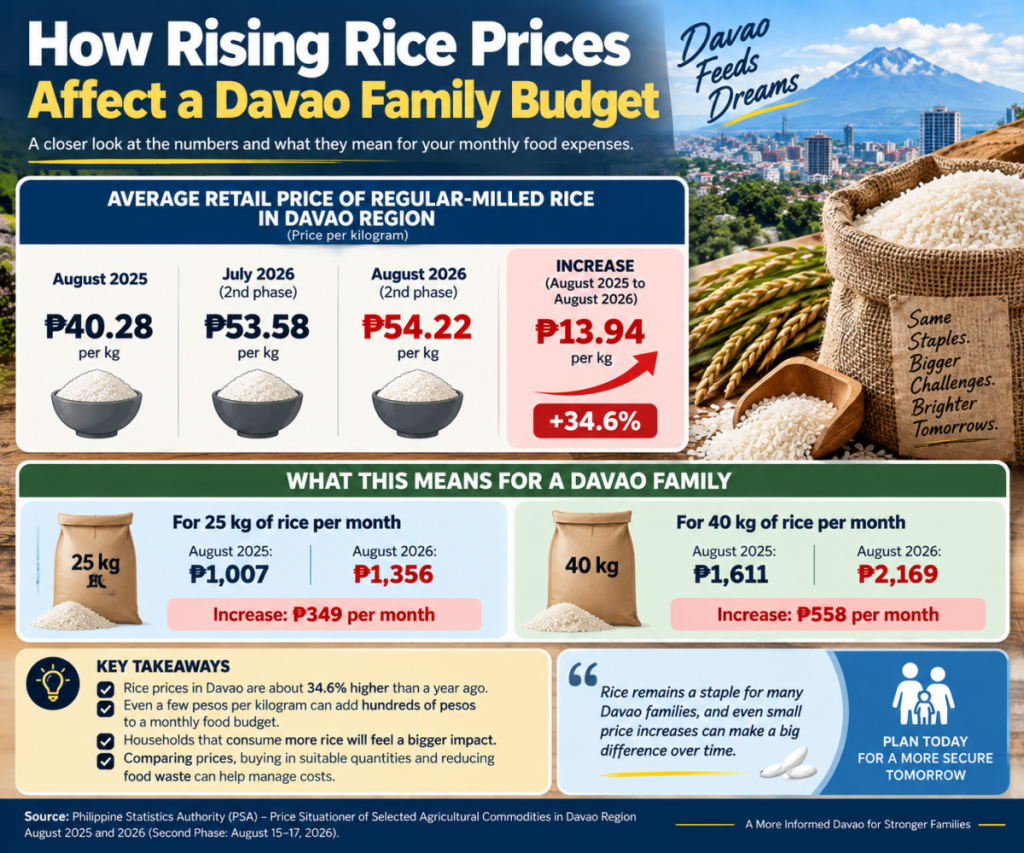
The PSA’s Davao Region price situationer reported an average retail price of ₱54.22 per kilogram for regular-milled rice during the second phase of August 2026, covering August 15 to 17.
That was lower than the ₱54.83 average recorded during the first phase of August but higher than the ₱53.58 average during the second phase of July.
The difference becomes more noticeable when compared with the same period in 2025, when the regional average was ₱40.28 per kilogram.
These figures are regional averages and should not be interpreted as a fixed retail price for every Davao City store, supermarket or public market.
Nevertheless, they demonstrate why rice can have a noticeable effect on a household budget.
Consider an illustrative household that consumes 25 kilograms of rice per month.
At ₱40.28 per kilogram, the monthly cost would have been approximately ₱1,007.
At ₱54.22 per kilogram, the same 25 kilograms would cost approximately ₱1,356.
The difference is about ₱349 per month.
For a household consuming 40 kilograms, the difference would be about ₱558 per month.
These are calculations based on selected PSA regional prices, not a forecast of what an individual family will pay.
The exercise simply shows how a change in a frequently purchased staple can accumulate over time.
Vegetables and fresh food can add another layer of pressure
Vegetables, tubers, plantains, cooking bananas and pulses recorded 22.8 percent inflation in Davao Region in August 2026.
These products can play an important role in ordinary Filipino meals, which means price movements may be noticed quickly during regular market trips.
Fresh-food prices can also be more variable than the price of some packaged products because they can be affected by production conditions, weather, supply, transportation and seasonal availability.
A family that buys the same vegetable every week may therefore find that its shopping bill changes even when the quantity purchased remains unchanged.
One practical response is flexibility.
If a particular vegetable becomes unusually expensive, a household can compare other locally available vegetables rather than automatically buying the same product at a higher price.
This does not require eliminating a preferred food permanently. It simply gives the household more options when prices fluctuate.
Fish and seafood are another important category
Fish and other seafood recorded 16.3 percent inflation in Davao Region in August 2026.
For families that rely heavily on fish as a regular protein source, this can matter even if rice represents the largest portion of their food purchases.
The effect will depend on the type of fish purchased, quantity consumed, buying frequency and where the household shops.
The regional inflation statistic also does not mean every type of fish increased by 16.3 percent.
Instead, it represents price movement for the broader category used in the consumer price index.
For household budgeting, this distinction is important.
Rather than applying 16.3 percent to every fish purchase, families can monitor the actual products they regularly buy.
Not every major food category is moving in the same direction
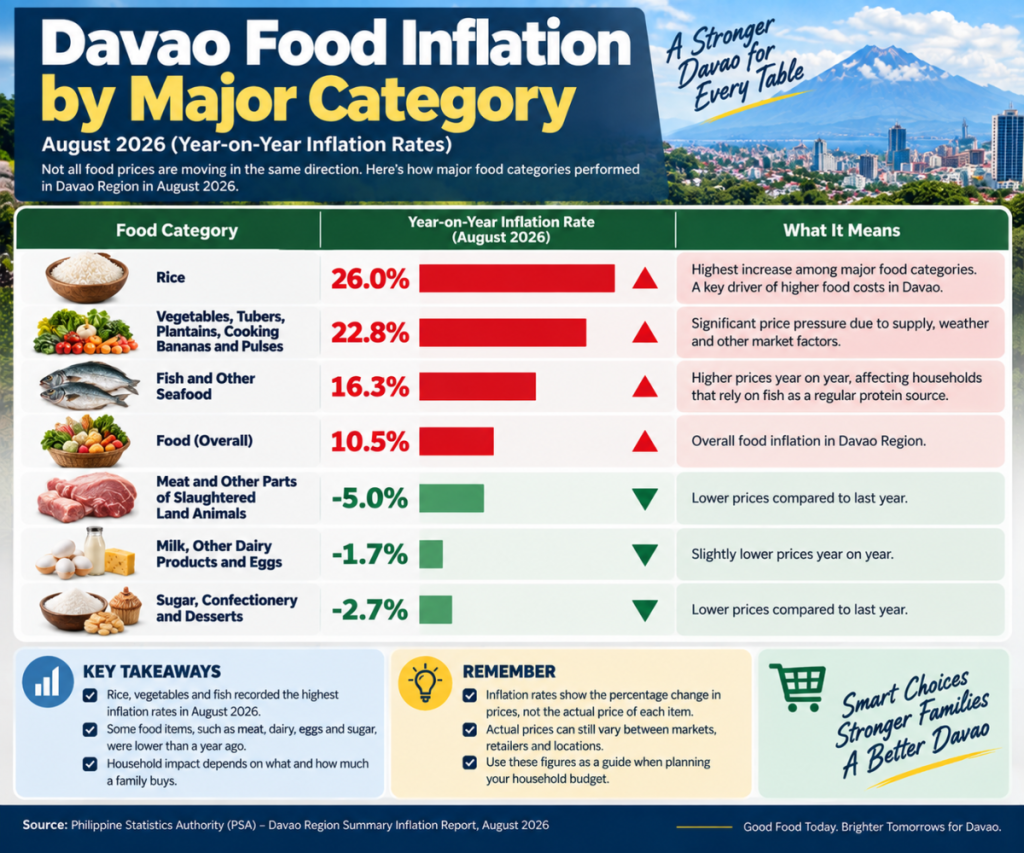
The latest PSA data provide another important lesson: food inflation is uneven.
Meat and other parts of slaughtered land animals recorded -5.0 percent year-on-year inflation in August 2026.
Milk, other dairy products and eggs recorded -1.7 percent, while sugar, confectionery and desserts recorded -2.7 percent.
A negative inflation rate for a category means the measured price index for that category was lower than the corresponding level a year earlier. It does not mean every individual product was cheaper in every store.
This matters because a family can sometimes reduce the effect of higher prices in one category by adjusting purchases in another.
However, households should not assume that cheaper meat, eggs or other products will always offset increases in rice, vegetables or fish.
The actual effect depends on the household’s consumption pattern.
What the Bottom 30% household data tell us
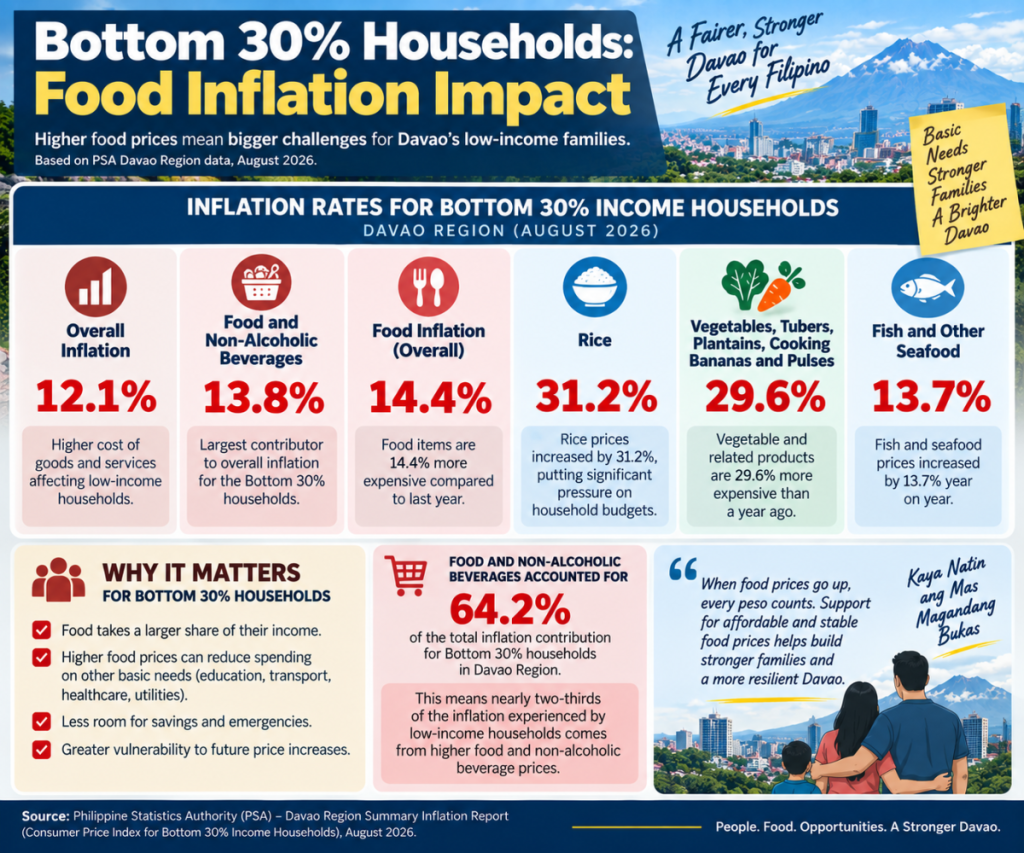
The PSA separately tracks inflation affecting Bottom 30% Income Households.
This is particularly relevant when discussing the household impact of food prices because families with less disposable income generally have less room to absorb increases in essential expenses.
In Davao Region, the overall inflation rate for Bottom 30% Income Households reached 12.1 percent in August 2026.
Food and non-alcoholic beverages recorded 13.8 percent inflation for this group, while food inflation itself reached 14.4 percent.
Rice inflation reached 31.2 percent.
Vegetables, tubers, plantains, cooking bananas and pulses reached 29.6 percent, while fish and other seafood recorded 13.7 percent.
Food and non-alcoholic beverages accounted for 64.2 percent of the overall inflation contribution for Bottom 30% Income Households.
This helps explain why food inflation can have a significant effect on households with limited disposable income.
An additional ₱1,000 in monthly food spending is not financially equivalent for every family. For a household with very little money left after necessities, that additional expense can affect savings, transportation, school expenses, utility payments or debt obligations.
What does a higher food bill look like in practice?
The easiest way to understand food inflation is to translate percentages into pesos.
Consider a hypothetical family with a monthly food budget of ₱15,000.
If the household’s entire food basket became 5 percent more expensive, maintaining exactly the same basket would require ₱15,750.
That means an additional ₱750 per month.
At a hypothetical 10 percent increase, the required budget would be ₱16,500, or ₱1,500 more per month.
At 15 percent, it would become ₱17,250, or ₱2,250 more.
At 20 percent, it would become ₱18,000, or ₱3,000 more.
These calculations are hypothetical. They do not claim that Davao food prices will increase by those exact percentages.
Their purpose is to show how a percentage change can become significant when applied to a recurring monthly expense.
An illustrative Davao family food budget
A four-person household might organize its monthly food budget approximately as follows:
| Category | Illustrative monthly budget |
|---|---|
| Rice and grains | ₱2,000 |
| Meat and poultry | ₱3,500 |
| Fish and seafood | ₱2,000 |
| Vegetables and fruits | ₱2,500 |
| Eggs and other protein | ₱1,200 |
| Cooking oil, seasonings and pantry items | ₱1,300 |
| Bread, snacks and other food | ₱1,000 |
| Other food purchases | ₱500 |
| Total | ₱14,000 |
This is an original illustrative budget created for this article.
It is not an official PSA household expenditure estimate and should not be presented as the amount a Davao family is expected to spend.
The purpose is to show how a family can organize its food spending.
Actual household budgets vary considerably.
A family with teenagers may consume more rice and protein. A household with young children may spend more on milk and school food. A family that regularly eats outside the home may have a much higher food budget.
The most useful budget is therefore the one based on the household’s own spending history.
How different price increases can affect that illustrative budget
The same illustrative ₱14,000 food budget can demonstrate the effect of a hypothetical 10 percent increase.
| Category | Original budget | Hypothetical 10% increase | Additional cost |
|---|---|---|---|
| Rice and grains | ₱2,000 | ₱2,200 | ₱200 |
| Meat and poultry | ₱3,500 | ₱3,850 | ₱350 |
| Fish and seafood | ₱2,000 | ₱2,200 | ₱200 |
| Vegetables and fruits | ₱2,500 | ₱2,750 | ₱250 |
| Eggs and other protein | ₱1,200 | ₱1,320 | ₱120 |
| Pantry items | ₱1,300 | ₱1,430 | ₱130 |
| Bread, snacks and other food | ₱1,000 | ₱1,100 | ₱100 |
| Other food purchases | ₱500 | ₱550 | ₱50 |
| Total | ₱14,000 | ₱15,400 | ₱1,400 |
This is not an inflation forecast.
It is a simple calculation showing that a 10 percent increase applied across a ₱14,000 food budget would require another ₱1,400 each month.
In reality, food categories rarely move in perfect synchronization.
That is precisely why families should track their actual purchases rather than applying one inflation percentage blindly to their entire grocery budget.
How to calculate your family’s personal food inflation
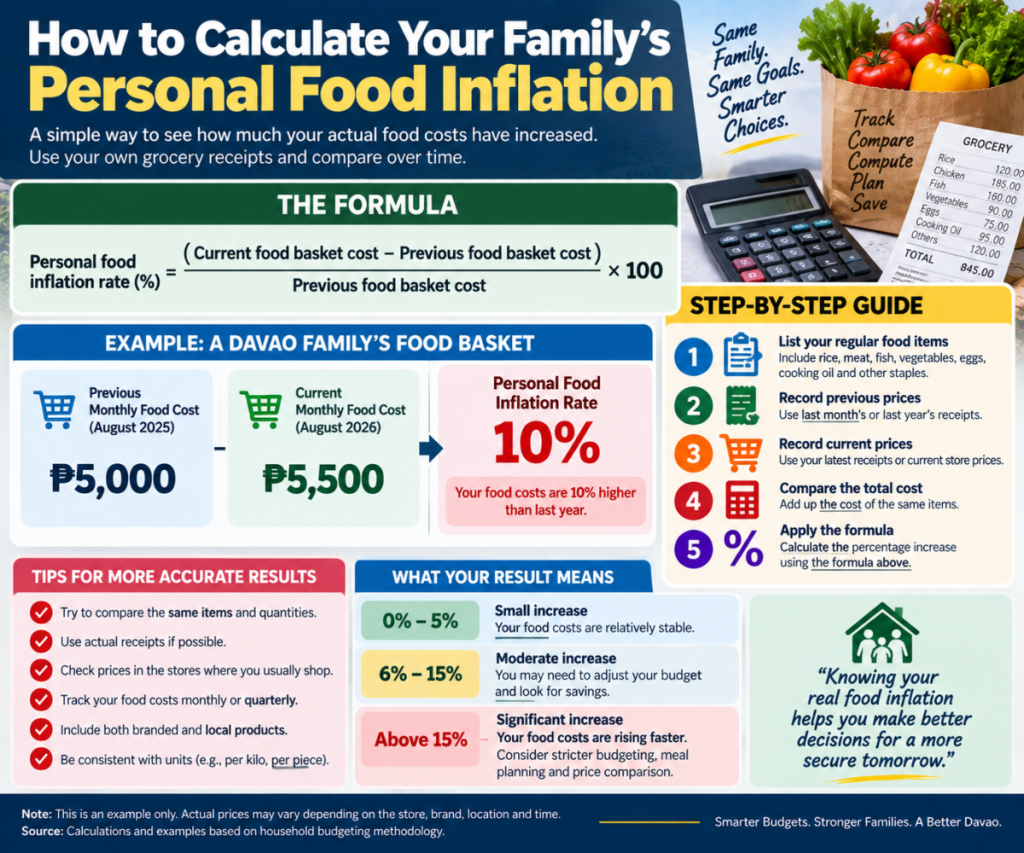
Households can also calculate a simple personal food-price change based on the products they regularly purchase.
The formula is:
Personal food-price change = (Current food basket cost − Previous food basket cost) ÷ Previous food basket cost × 100
For example, suppose the same household food basket cost ₱5,000 three months ago and now costs ₱5,500.
The calculation would be:
(₱5,500 − ₱5,000) ÷ ₱5,000 × 100 = 10%
The household’s selected food basket therefore became 10 percent more expensive.
This is not an official inflation measure. It is a household budgeting calculation.
It can nevertheless be useful because it reflects what the family actually buys.
A household that spends heavily on rice and vegetables may have a different personal food-price change from one that spends more on other categories.
Why a family should track its own food inflation
A household can calculate a more useful personal food-price trend by tracking its own regular purchases.
Start with the previous three months of grocery receipts, market purchases and other food expenses.
Then identify the products purchased most frequently.
For example:
- Rice
- Chicken
- Pork
- Fish
- Eggs
- Vegetables
- Fruits
- Cooking oil
- Bread
- Coffee
- Condiments
- Snacks
Record the quantity purchased and the amount paid.
After several months, the household can compare prices and identify which categories are causing the largest changes.
This is more useful for personal budgeting than simply reading a regional inflation headline.
A simple household food-price tracking system
A basic spreadsheet or notebook can contain five columns:
| Product | Quantity | Previous price | Current price | Difference |
|---|---|---|---|---|
| Rice | 25 kg | — | — | — |
| Chicken | 10 kg | — | — | — |
| Fish | 8 kg | — | — | — |
| Vegetables | 15 kg | — | — | — |
| Eggs | 10 dozen | — | — | — |
The family does not need to track every item sold in the market.
It can focus on the 10 to 20 products it buys most often.
After three or four months, this creates an informal household price tracker.
It is not an official statistical measure, but it can be a useful budgeting tool.
Grocery stores versus public markets
Where a family shops can also influence how efficiently it uses its food budget.
Public markets may provide opportunities to compare fresh produce, meat and seafood among multiple sellers. Supermarkets can offer standardized packaging, promotions, loyalty programs and convenience.
Neither option is automatically cheaper for every product.
The better approach is to compare actual prices.
For example, a household can compare the price per kilogram of rice, chicken, fish and vegetables rather than deciding that the entire public market or supermarket is cheaper.
The timing of purchases can also matter.
Fresh produce may be more suitable for frequent smaller purchases, while shelf-stable products may make sense in larger quantities when the unit price is lower.
The key is to consider both the unit price and the likelihood that the family will actually use the product.
Unit price matters more than package size
A large package does not automatically represent a better deal.
Suppose one product costs ₱300 for five kilograms.
Its unit price is:
₱300 ÷ 5 = ₱60 per kilogram
Another product might cost ₱130 for two kilograms.
Its unit price is:
₱130 ÷ 2 = ₱65 per kilogram
The larger package is cheaper per kilogram.
However, buying the cheaper unit price is only beneficial if the family can consume the product before it expires or spoils.
A ₱20 saving is not really a saving if the household throws away ₱50 worth of unused food.
Reducing food waste can be as important as finding discounts
Food waste is one of the easiest household expenses to overlook.
A family may carefully compare prices but still lose money by purchasing more food than it can consume.
Simple habits can help:
- Check the pantry before shopping.
- Review the refrigerator before buying vegetables.
- Plan several meals before making a shopping list.
- Buy highly perishable food in realistic quantities.
- Freeze suitable meat and fish.
- Use older pantry items before opening new ones.
- Cook portions appropriate for the number of people eating.
- Plan how leftovers will be used.
These actions do not require the family to reduce food quality.
They simply help ensure that more of the food purchased is actually consumed.
Flexible meal planning can protect the budget
A rigid meal plan can become expensive when the price of one ingredient suddenly increases.
A flexible plan gives households alternatives.
For example, a family might have several possible vegetable dishes and select among them based on availability and price.
The same approach can be applied to protein.
If one fish variety becomes expensive, another available variety may be considered. If a particular meat cut becomes costly, the household can compare other cuts or alternative protein sources.
The goal is not to buy the cheapest food available.
The goal is to maintain reasonably nutritious meals while giving the household enough flexibility to respond to price changes.
Cheap does not always mean better
Budgeting should not become a race to find the lowest possible price.
Food choices also involve nutritional value, quality, household preferences and waste.
A very cheap product that nobody in the family eats is not necessarily a good purchase.
Likewise, buying a large quantity of a discounted product is not a saving if much of it eventually gets thrown away.
A more useful question is:
“Does this purchase provide enough value for the money the household spends?”
That allows families to consider price alongside nutrition, quantity, quality and actual consumption.
How higher food prices affect savings
When food costs increase, households often have to adjust other parts of the budget.
An additional ₱1,000 per month in food spending represents ₱12,000 over a year.
An additional ₱1,500 per month represents ₱18,000.
That money may otherwise have been used for:
- Emergency savings
- School expenses
- Transportation
- Utilities
- Debt repayment
- Household repairs
- Insurance
- Family activities
For households with substantial disposable income, the adjustment may involve reducing discretionary spending.
For households with limited income, the same increase can affect essential expenses.
This is why food inflation can have effects beyond the grocery receipt.
A practical strategy for a more resilient Davao food budget
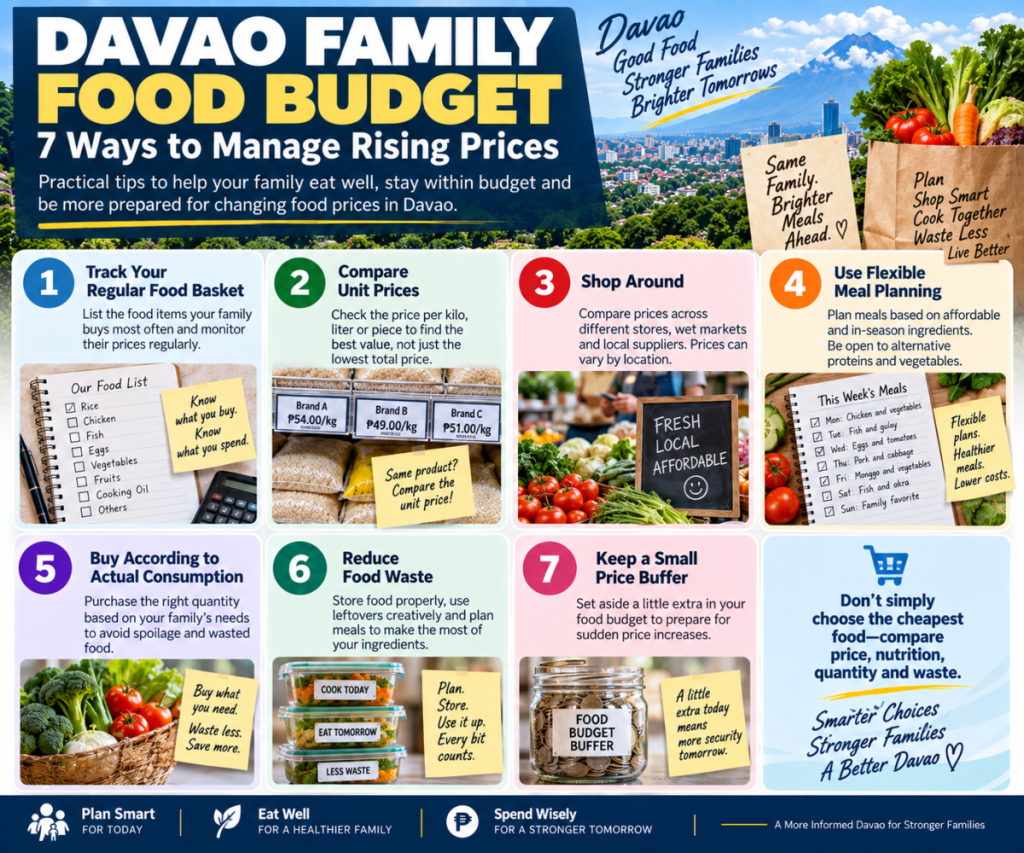
A household dealing with higher food prices does not necessarily need to make dramatic changes.
A more sustainable approach is to divide the food budget into four parts.
Core food budget:
Money needed for regular staples, protein, vegetables, fruits and other essential food.
Flexible food budget:
Money available for snacks, occasional treats and purchases that can be adjusted when necessary.
Price buffer:
A modest amount reserved for unexpected price changes.
Waste-control strategy:
Habits that prevent purchased food from being unnecessarily discarded.
This approach is more resilient than assigning a fixed amount to every product and assuming prices will never change.
A simple monthly food-budget review
At the end of each month, a household can ask six basic questions.
How much did we actually spend?
Compare the total with the planned amount.
Which categories cost the most?
Look at rice, meat, fish, vegetables and pantry products separately.
Which prices changed?
Identify products that increased significantly.
Did we waste food?
Review spoiled produce, unused leftovers and expired products.
Did convenience purchases affect the budget?
Restaurant meals, delivery orders and convenience-store purchases can materially affect food spending.
What can we change next month?
Choose one or two realistic adjustments rather than completely redesigning the household’s eating habits.
The difference between food inflation and actual food prices
Inflation and price levels are related but not identical concepts.
A price situationer tells readers how much a selected commodity costs during a specific monitoring period.
Inflation measures the percentage change in prices over time.
For example, the PSA reported an average regional price of ₱54.22 per kilogram for regular-milled rice during the second phase of August 2026.
Separately, the PSA reported rice inflation of 26.0 percent for Davao Region during August.
The two figures answer different questions.
The price situationer answers:
“What was the observed average price of this commodity during the reference period?”
The inflation statistic answers:
“How has the price index for this category changed compared with the corresponding period?”
Using both sources together gives consumers a better understanding of the market.
What the latest rice price data show
The PSA reported that regular-milled rice averaged ₱54.22 per kilogram in Davao Region during August 15–17, 2026.
During August 1–5, the average was ₱54.83.
The second-phase August price was therefore slightly lower than the first-phase August price.
However, the second-phase August 2026 price was considerably higher than the ₱40.28 regional average recorded during the corresponding period in August 2025.
This illustrates another important point: prices can move in different directions over short periods while remaining significantly higher than a year earlier.
A family should therefore avoid interpreting one monitoring period as a permanent new price.
Other commodity prices provide useful context
The same PSA price situationer reported an average regional retail price of ₱262.39 per kilogram for fresh pork meat with bones during the second phase of August 2026.
This was lower than the ₱272.53 recorded during the second phase of July but higher than the ₱261.14 reported during the first phase of August.
These figures show why food budgeting should focus on actual price movements rather than assuming that every commodity follows the same trend.
How families can use official data without becoming overwhelmed
Consumers do not need to become economists to use inflation data.
A practical approach is to monitor only the products that matter most to the household.
For example, a family may track:
- Rice
- Chicken
- Pork
- Fish
- Eggs
- Vegetables
- Cooking oil
- Fruits
- Bread
- Other frequently purchased staples
Then compare those prices once or twice a month.
The purpose is not to predict the market.
It is to identify changes early enough to adjust the household budget.
Why official sources are better than random online price lists
Food prices can change quickly.
A blog post published months earlier may contain prices that are no longer representative.
Social-media posts may show prices from a particular store, neighborhood or date without enough context.
Official sources such as the PSA and Department of Agriculture provide a stronger foundation because they explain their data and monitoring processes.
That does not mean official data will match the price of every product in every store.
It means they provide a credible benchmark against which household observations can be compared.
Weather and supply can influence food prices
Fresh-food prices are affected by more than consumer demand.
Weather conditions can influence farm production, fishing activity, transportation and the availability of agricultural products.
When supply is temporarily disrupted, certain products may become more expensive.
Davao’s geographic size also means transportation can be an important part of moving agricultural products from farms and production areas to markets.
Households cannot control these market conditions, but they can reduce the effect by maintaining flexible shopping and meal-planning habits.
What rising food prices mean for a family budget
The impact of higher food prices extends beyond food.
If a family needs another ₱1,500 each month to maintain its previous food basket, that is ₱18,000 over a year.
The household must either increase available income, reduce food spending through substitutions and efficiency, or reduce another category of expenditure.
For a family with limited financial flexibility, that decision can be difficult.
For this reason, food budgeting should be part of a broader household financial plan.
Families should consider food alongside housing, utilities, transportation, education, healthcare, debt and savings.
What Davao families should remember
The latest statistics show that food-price pressure remains an important household budgeting issue in Davao Region in 2026, but the effect is not identical for every family.
The PSA reported 10.5 percent food inflation in Davao Region in August 2026. Rice inflation reached 26.0 percent, vegetables and related products reached 22.8 percent, and fish and other seafood reached 16.3 percent.
For Bottom 30% Income Households, food inflation was 14.4 percent and rice inflation reached 31.2 percent.
Davao City itself recorded headline inflation of 6.7 percent, demonstrating why city-level and regional statistics should not be treated as interchangeable.
These numbers provide important context, but they are not personal household forecasts.
A family’s actual experience depends on what it buys, how much it consumes, where it shops and how easily it can substitute between products.
For households trying to manage rising food costs, the most practical response is to understand their own spending.
Track the major food categories. Compare unit prices. Reduce waste. Plan meals with some flexibility. Use reliable government data as a reference. Maintain a reasonable price buffer when finances allow.
Most importantly, avoid making financial decisions based solely on a single headline about inflation.
A good food budget should help a family understand where its money is going and give it enough flexibility to adapt when prices change.
Sources and methodology
This article uses primarily official Philippine government data.
The Philippine Statistics Authority Regional Statistical Services Office XI provided the August 2026 Davao Region inflation data, including headline inflation, food inflation, rice inflation, fish and seafood inflation, and vegetable-related inflation.
The PSA also publishes a separate inflation report for Bottom 30% Income Households, which was used to explain how food-price pressure can differ across income groups.
PSA Davao Region’s agricultural commodity price situationers were used for selected observed retail prices, including regular-milled rice and fresh pork during August 2026.
The Department of Agriculture’s official price-monitoring resources provide additional information for monitoring agricultural commodity prices.
All household budgets, scenario calculations, comparison tables and budgeting examples in this article are original illustrative calculations created to explain the possible household impact of food-price changes.
They are not official PSA household expenditure estimates, government-recommended budgets or forecasts of future food prices.
The article also distinguishes between inflation rates and actual commodity prices. An inflation rate describes the change in a price index over time, while a price situationer reports observed prices for selected commodities during a specified monitoring period.
Because food prices can change between reporting periods and can differ among retailers and locations, readers should use the latest available PSA and Department of Agriculture information when making actual household purchasing or budgeting decisions.
Primary sources
Philippine Statistics Authority – Davao Region Summary Inflation Report, August 2026
Used for regional headline inflation, food inflation, commodity-group inflation and contribution data.
Used for inflation information affecting lower-income households, including food and rice inflation.
Used for observed regional retail prices of selected agricultural commodities during August 2026.
Department of Agriculture – Official Price Monitoring
Used as a supporting government reference for agricultural commodity price monitoring.









 Facebook
 Twitter